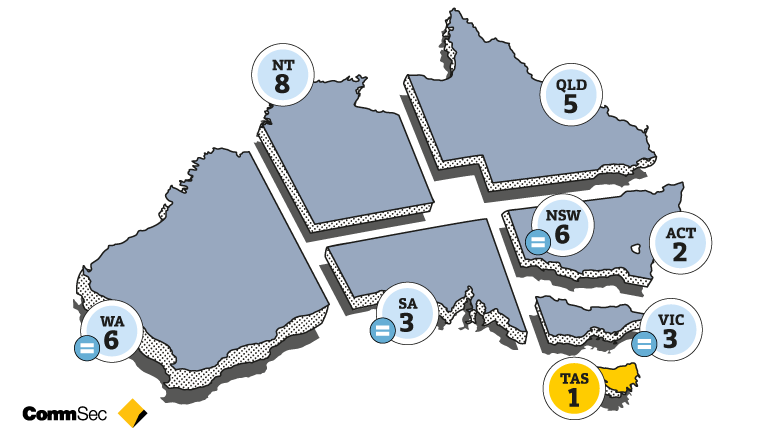
The ACT economy remains in second position, continuing its best performance in the economic rankings in just over three years.
South Australia is now in equal third spot with Victoria. The joint third ranking for South Australia is its highest position in just over a decade while the equal sixth ranking for NSW is its lowest position in eight years, closely following Queensland in the fifth spot. The Northern Territory continues to lag the other states in the economic performance rankings.
CommSec Chief Economist Craig James said: “We began to see compression in the economic rankings in the last quarter, and this has continued in the latest report.
“Queensland, South Australia and Western Australia were the biggest improvers over the past quarter with their success in supressing the COVID-19 virus appearing to have supported these states’ economic performance. Victoria and ACT suffered more in their rankings due to the uncertainty and change brought by the Pandemic.
“Each state and territory has been impacted differently by the pandemic. Some have faced stricter lockdowns, tighter border closures or they may be more reliant on international tourism. Anecdotally, we’ve seen domestic tourism hot spots benefit from the foreign border closures as more Aussies spend money locally.
“Regardless, the compression in the rankings shows that the pandemic, and likely the government’s economic stimulus, is somewhat of a leveller. Australia’s state and territories have arguably never been closer together in terms of economic performance.
“Tasmania and the ACT will likely consolidate their top two positions in the coming quarters, while Western Australia has potential to lift further in the rankings given solid growth of key economic indicators.”
“Future reports will continue to prove valuable to policymakers as they look to scale back economic stimulus over 2021.” Mr James said.
The State of the States report uses the most recent economic data available, however while some data relates to the September quarter, other data – such as unemployment – is timelier, covering the month of December.
State and territory highlights
- Tasmania is ranked first on relative population growth, equipment investment, dwelling starts and retail trade. The lowest ranking on other indicators is fourth.
- ACT remains in second position on the overall performance rankings. The ACT leads other economies on relative unemployment.
- South Australia remains in third position on the economic performance rankings, sharing the spot with Victoria. South Australia is second-ranked on relative population growth and relative unemployment.
- Victoria is in joint third spot on the performance rankings. Victoria still ranks first on relative economic growth and construction work done. Victoria’s lowest ranking is eighth position on retail trade.
- Queensland is now fifth in the performance rankings. Queensland is ranked in first spot for housing finance. However, Queensland is seventh-ranked for both relative unemployment and relative economic growth.
- NSW is in joint sixth position in the rankings. While second-ranked on housing finance it is ranked seventh on equipment investment.
- Western Australia is joint sixth on the performance rankings, up from seventh. It’s also ranked second on equipment investment and third on relative economic growth relative unemployment. However, WA is ranked seventh on dwelling starts and construction work done.
- The Northern Territory is fifth-ranked on relative economic growth and seventh on retail trade. However, Northern Territory lags all of the other states and territories on the other six indicators.
Annual growth rates
- Annual changes in economic indicators are useful for measuring economic momentum.
- On the eight indicators assessed, Western Australia and the ACT top the annual changes on two measures. All of the other economies except NSW and South Australia are on top for annual growth on one of four economic indicators.
- When looking across growth rates for the states and territories, Western Australia exceeds the national average on seven of the eight indicators.
To access the full State of the States Report for January 2021, including a breakdown of each economic indicator and additional commentary from CommSec’s Chief Economist, Craig James, visit commsec.com.au/stateofstates
Interviews with Craig can be requested via the CBA Media team on (02) 9118 6919 or media@cba.com.au.
About the State of the States Report
CommSec, the digital broking arm of Australia’s largest bank, assesses the performance of each state and territory on a quarterly basis using eight key indicators. Those indicators include: economic growth, retail spending, equipment investment, unemployment, construction work done, population growth, housing finance, and dwelling commencements.
Just as the Reserve Bank uses long-term averages to determine the level of "normal" interest rates, CommSec compares the key indicators to decade averages; that is, against "normal" performance. CommSec also compares annual growth rates for eight key indicators for all states and territories, in addition to Australia as a whole, enabling a comparison of economic momentum.

